
Wegovy weight loss results from the drug’s own clinical trial program show an average loss of roughly 15% of body weight over 68 weeks in adults without diabetes, compared with about 2% to 3% on placebo. That headline number is the one most people have already seen in ads, news coverage or a friend’s retelling. It’s also a group average pulled from thousands of trial participants, not a promise about what happens to any one person who starts an injection pen.
The fuller picture is more layered than one number can carry. Novo Nordisk ran eight major Phase 3 trials for semaglutide 2.4 mg, known as the STEP program, plus a newer trial behind a higher-dose version FDA approved in March 2026. Results shift in meaningful ways depending on whether someone has type 2 diabetes, how far into treatment they are, and what happens if they stop. Studies published after Wegovy reached pharmacies also show real-world results running noticeably lower than the trial numbers, for reasons that have more to do with dosing, cost and adherence than with the drug losing potency in anyone’s body.
This guide walks through what the STEP trials actually found, on what timeline, for which populations, and what the evidence shows about stopping treatment and about why real-world results so often land below the trial averages. It’s built from FDA prescribing information, the published STEP trials, and a 2025 real-world cohort study, not from a hands-on test of the medication. Nothing here is personalized medical advice, and nothing in this guide is a reason to start, stop or change a prescription medicine without a clinician who knows your own health history.
Women make up the large majority of participants in Wegovy’s own pivotal trial, and several of the factors covered later in this guide, including type 2 diabetes status, dose tolerance and the realistic timeline for seeing results, matter just as much for a woman weighing this medication as any single headline percentage does. Where it’s relevant, this guide also points toward our related coverage of weight changes tied to menopause, PCOS and life after 40, since none of those life-stage factors were the primary focus of the STEP trials themselves.
Wegovy Weight Loss Results: The Clinical Trial Averages
Every number in this guide traces back to a specific trial, so it helps to start with what each one actually measured before comparing any of them to each other.
Average Weight Loss in the STEP 1 Trial (Adults Without Diabetes)
STEP 1 is the trial FDA leaned on most heavily for Wegovy’s original chronic-weight-management approval, and it’s the source of the 14.9% figure you’ll see quoted almost everywhere.
Mean Percent Body Weight Change at 68 Weeks
In STEP 1, 1,961 adults with obesity or overweight who didn’t have diabetes lost an average of 14.9% of their body weight on semaglutide 2.4 mg over 68 weeks, compared with 2.4% on placebo, a 12.4 percentage-point difference. In absolute terms, that worked out to about 15.3 kg (roughly 34 lb) lost on average with semaglutide versus 2.6 kg on placebo. Those are the two numbers behind nearly every “up to 15% body weight” claim you’ll see in marketing copy, and they come from one specific population: adults with a body mass index in the obesity or overweight range who did not have type 2 diabetes at enrollment.
About three-quarters of STEP 1’s participants were women, and the average age across the trial was in the mid-to-late 40s, so the trial’s population overlaps meaningfully with the women this site covers, even though the trial itself wasn’t designed to study menopause, PCOS or any other life-stage factor separately. Everyone in the trial also received counseling on diet and physical activity alongside the medication or placebo, which matters later in this guide when real-world results are compared against these numbers.
How Many People Reached 5%, 10%, and 15% Weight Loss
Averages can hide how spread out individual results actually were, so STEP 1 also reported the share of participants who crossed specific weight-loss thresholds. 86.4% of the semaglutide group lost at least 5% of their starting weight, versus 31.5% on placebo; 69.1% reached at least 10%, versus 12.0% on placebo; and 50.5% reached at least 15%, versus 4.9% on placebo. Put differently, about half of the semaglutide group lost 15% or more, but roughly one in eight didn’t even reach the 10% mark, and a small minority lost less than 5%. The average describes the middle of a genuinely wide range of outcomes, not a result everyone converged on.
These thresholds aren’t arbitrary cutoffs invented for this guide; they’re the same ones researchers commonly use because even a 5% loss is associated with measurable improvements in blood pressure, blood sugar and cholesterol, while losses of 10% or more tend to track with larger improvements still. That’s part of why the share of people crossing each line matters as much as the group’s overall average: two trials with the same average percentage could still look very different if one has most people clustered near that number and the other has a wide split between big responders and people who saw very little change.
Why One Number Can’t Represent the Whole STEP Program
STEP 1 is famous, but it’s one trial among several, each asking a slightly different question with a different group of people.
Seven Trials, Seven Different Study Populations
Novo Nordisk’s STEP program eventually ran to eight numbered trials plus a newer post-approval trial, and no two of them studied quite the same group of people for quite the same length of time. STEP 2 enrolled adults with type 2 diabetes; STEP 3 added structured behavioral counseling and an initial low-calorie diet; STEP 4 specifically tested what happens when semaglutide is continued versus withdrawn after 20 weeks; STEP 5 followed people for a full two years instead of 68 weeks; and STEP 8 compared semaglutide head-to-head against a different, older weight-loss injection. The 2026 STEP UP trial tested an entirely different, higher dose. Treating any single number from this program as “the” Wegovy result skips over how differently each trial was built.
Two other numbered trials, STEP 6 and STEP 7, tested the same 2.4 mg dose in East Asian study populations as part of the broader development program; this guide wasn’t able to independently verify their specific results in the sources read this session, so they’re mentioned here only to explain why “the STEP program” is bigger than the handful of trials most U.S.-focused articles name. This guide focuses on the trials most directly tied to Wegovy’s U.S. approval and most relevant to a U.S. readership.
What a Trial Average Does and Doesn’t Tell You
A trial average tells you what a specific group of people, enrolled under specific criteria and followed with regular clinical support, achieved on average over a specific number of weeks. It doesn’t tell you what you, specifically, will achieve, because your starting weight, health conditions, dose tolerance, diet, activity level and adherence over many months all move the needle in ways a single population statistic can’t capture.
Statisticians sometimes describe this with the idea of spread, or variance: two people could both be told “the average result is 15%,” and one could end up at 8% while the other reaches 22%, and both outcomes are fully consistent with that same reported average. STEP 1’s own threshold data earlier in this section shows that spread directly, since a meaningful share of participants landed well above or well below the 14.9% headline figure. Every percentage in this guide describes a group, not a personal forecast, and that distinction matters more than almost anything else in this article. Table 1 lines up the headline results from each major trial so you can see how much they actually move around.
| Trial | Population | Duration | Semaglutide result | Comparator result |
|---|---|---|---|---|
| STEP 1 | Adults with obesity/overweight, no diabetes (n=1,961) | 68 weeks | −14.9% body weight | Placebo: −2.4% |
| STEP 2 | Adults with overweight/obesity and type 2 diabetes (n=1,595) | 68 weeks | −9.6% body weight | Placebo: −3.4% |
| STEP 3 | Adults with overweight/obesity, plus intensive behavioral therapy (n=611) | 68 weeks | −16.0% body weight | Placebo (+ behavioral therapy): −5.7% |
| STEP 4 | Adults who lost weight in a 20-week run-in, then randomized to continue or stop (n=803) | 68 weeks total | Continued: additional −7.9% after week 20 (≈−17.4% cumulative) | Switched to placebo at week 20: regained +6.9 points by week 68 |
| STEP 5 | Adults with overweight (plus a comorbidity) or obesity (n=304) | 104 weeks (2 years) | −15.2% body weight | Placebo: −2.6% |
| STEP 8 | Adults with obesity/overweight, no diabetes; head-to-head design (n=338) | 68 weeks | −15.8% body weight | Liraglutide 3.0 mg: −6.4% |
| STEP UP | Adults with obesity, no diabetes; tests the 7.2 mg dose (n=1,407) | 72 weeks | 7.2 mg: −20.7% body weight | 2.4 mg and placebo arms included; placebo’s specific percentage wasn’t reported in the sources read for this guide |
Table 1 method: figures are as reported in each cited trial or trial summary, read as of October 2, 2026. Every row comes from a different trial, with a different population, duration or design; only STEP 4’s two arms, STEP 8’s semaglutide-versus-liraglutide arms, and STEP UP’s dose-comparison arms were tested within the same randomized trial. Comparing rows across trials (for example, STEP 1 versus STEP 2) is a side-by-side look at separate studies, not a head-to-head result.
The Wegovy Weight-Loss Timeline: What Happens Week by Week
Knowing the eventual average doesn’t tell you what the experience actually looks like along the way, and that timeline question is one of the most common things people search for before starting.
The First Few Months: Dose Titration and Early Changes
Wegovy isn’t started at its effective dose on day one, and that titration schedule shapes almost everything about the early timeline.
Why Wegovy Starts at a Low Dose and Builds Up Slowly
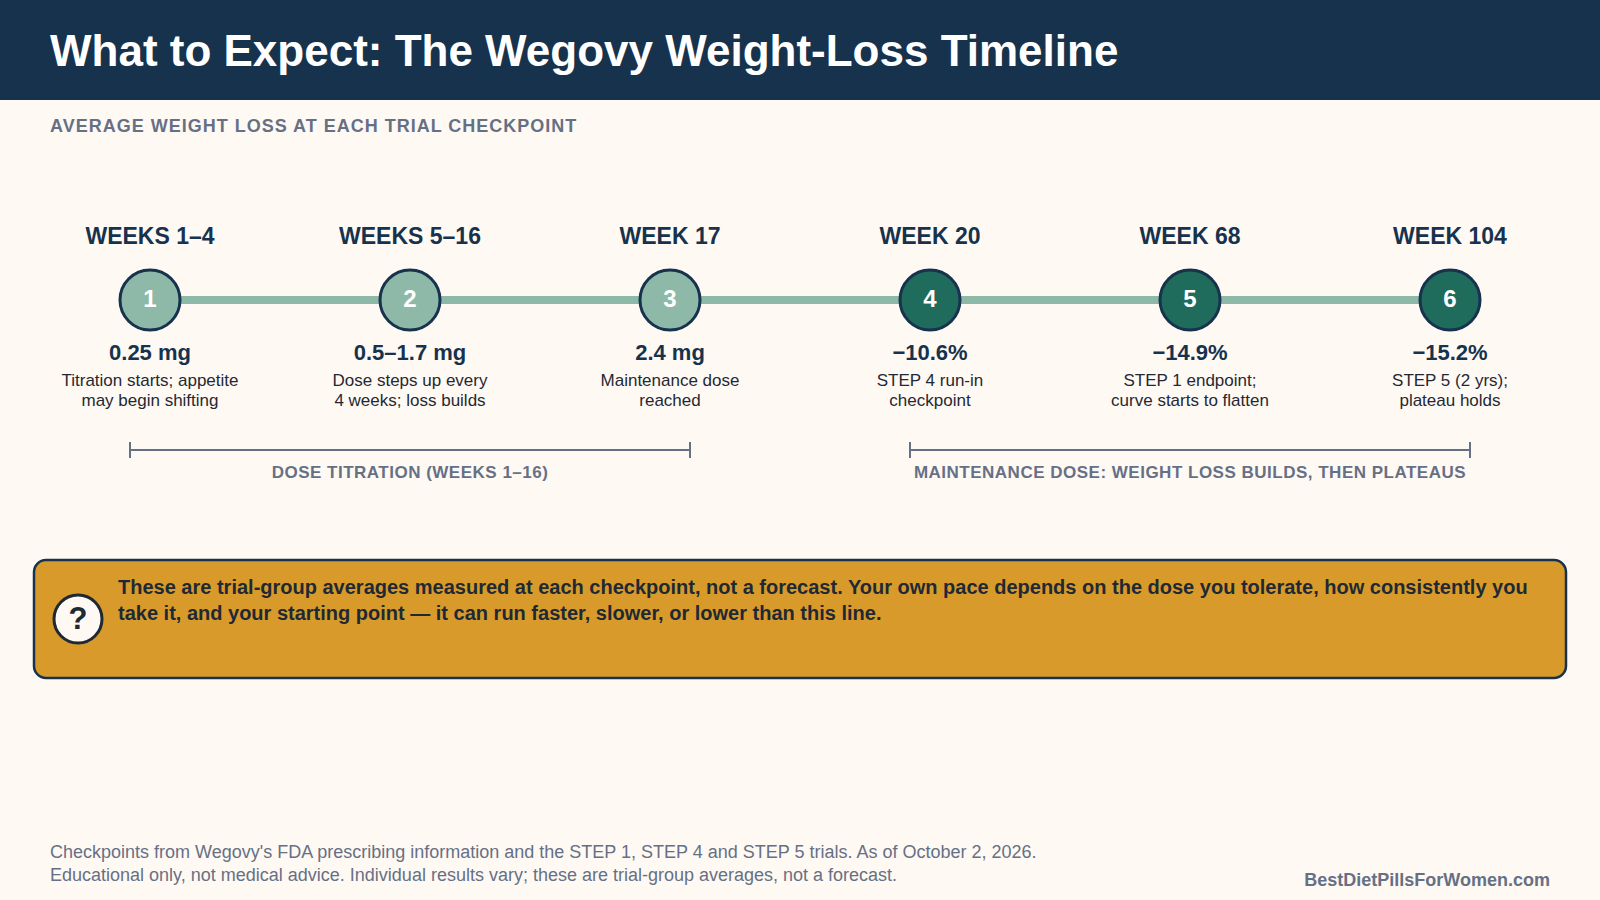
Wegovy’s label calls for a five-step dose increase: 0.25 mg weekly for the first 4 weeks, then 0.5 mg, 1 mg and 1.7 mg, each held for 4 weeks, before reaching the standard 2.4 mg maintenance dose around week 17. The slow climb exists mainly to reduce nausea and other digestive side effects, which tend to be worse at higher doses and during each step up. That means for the first four months, most people are taking less than the dose the headline trial results were measured at, which has real consequences for what “early results” should realistically look like.
Wegovy is delivered as a once-weekly subcutaneous injection, typically into the abdomen, thigh or upper arm, using a prefilled pen. The specific day of the week doesn’t matter much as long as it stays roughly consistent, but the once-weekly rhythm itself is part of why the drug’s effects build gradually rather than peaking and fading the way a once-daily medicine might.
What Early Weight Loss Typically Looks Like
Appetite changes and modest weight loss often begin within the first few weeks, even at the lowest 0.25 mg dose, since semaglutide starts acting on appetite-regulating pathways in the brain and gut as soon as it’s in the body. But the bulk of the eventual result builds gradually over months, not days. A useful mental model is that the first month or two typically brings a noticeable but modest change, with the pace picking up as the dose rises toward 2.4 mg, rather than a dramatic early drop followed by a plateau.
Part of the mechanism behind that early change is that semaglutide slows how quickly food moves through the stomach, which tends to make smaller portions feel more filling, on top of its separate effect on appetite signals in the brain. That slower digestion is also part of why nausea and fullness-related side effects tend to show up early and around each dose increase, a point this guide returns to in the safety section later on.
Week 17 Through the Trial Endpoint: Steady Loss Toward a Plateau
Once someone reaches the maintenance dose, the shape of the weight-loss curve becomes clearer from trial data collected at multiple checkpoints.
The Climb From Week 17 to Around Week 60
STEP 4’s design offers a useful mid-trial checkpoint: participants who’d been on semaglutide for 20 weeks, covering the full titration plus a few weeks at maintenance dose, had already lost an average of 10.6% of their body weight by that point. Those who stayed on semaglutide for the rest of the trial kept losing weight at a slower pace after that, reaching an estimated 17.4% cumulative loss by week 68, which suggests the steepest part of the curve happens in roughly the first five months, with real but more gradual loss continuing for several months after.
That shape, a fast initial climb followed by a slower but still meaningful continued loss, is the opposite of what some people expect going in. It’s common to assume the first few weeks will bring the biggest visible change, when the trial data actually points the other way: the most dramatic average changes tend to show up in months three through six, once the full maintenance dose has had time to take effect.
When Weight Loss Levels Off, According to STEP 1 and STEP 5
STEP 1’s own report describes the weight curve flattening out by around week 60, and STEP 5’s two-year data essentially confirms it: at 104 weeks, the average loss was 15.2%, barely different from STEP 1’s 68-week average of 14.9%. In practical terms, that means the active losing phase for most people runs through roughly the first 14 to 16 months of consistent treatment, after which the number on the scale tends to stabilize rather than keep dropping indefinitely. A plateau at this stage isn’t a sign that the medication has stopped working; trial data suggests it’s simply the point where a new, lower weight has become the body’s new equilibrium on that dose.
Researchers studying GLP-1 medications generally attribute this plateau partly to the body’s energy needs shrinking along with its size: a smaller body simply burns somewhat fewer calories at rest, which narrows the gap the medication’s appetite-suppressing effect has to work against. That’s a normal, expected part of weight-loss physiology rather than something specific to Wegovy, and it’s one more reason a flattening curve around 60 to 68 weeks shouldn’t be read as a warning sign on its own.
| Time point | Dose reached | What trial data shows |
|---|---|---|
| Weeks 1–4 | 0.25 mg weekly | Titration begins; appetite changes and modest loss may start, GI side effects most common during dose increases |
| Weeks 5–16 | 0.5 mg → 1 mg → 1.7 mg, stepped up every 4 weeks | Dose continues climbing; weight loss builds gradually alongside it |
| Week 17 onward | 2.4 mg weekly (maintenance) | Full dose reached; this is the dose STEP 1’s headline 14.9% figure was measured at |
| Week 20 | 2.4 mg | STEP 4’s run-in checkpoint: 10.6% average loss reached in that cohort |
| Weeks 60–68 | 2.4 mg | Loss begins to flatten; STEP 1’s 68-week average reaches 14.9% |
| Week 104 (2 years) | 2.4 mg | STEP 5 reports 15.2%, essentially matching the 68-week figure: the plateau holds |
Table 2 method: time points and doses are as described in Wegovy’s FDA prescribing information; weight-loss percentages at each checkpoint are as reported in the STEP trials, read as of October 2, 2026. These are trial-group averages, not a week-by-week forecast for any individual.
Does Wegovy Work Differently With or Without Type 2 Diabetes?
One of the clearest, most consistent patterns across the STEP program is that having type 2 diabetes changes the average result, and it’s worth understanding why before assuming a single figure applies to you.
Weight Loss in People With Type 2 Diabetes: The STEP 2 Trial
STEP 2 is the trial that answers this question most directly, since it enrolled exclusively adults who already had type 2 diabetes alongside overweight or obesity.
STEP 2’s Results and Why They Ran Lower Than STEP 1
STEP 2 enrolled 1,595 adults with type 2 diabetes and found an average 9.6% body-weight loss on semaglutide 2.4 mg over 68 weeks, compared with 3.4% on placebo; 68.8% of the semaglutide group reached at least 5% weight loss, versus 28.5% on placebo. That 9.6% average is meaningfully smaller than STEP 1’s 14.9%, even though both trials used the same dose and the same 68-week window. Researchers have proposed a few explanations, including that type 2 diabetes itself can involve metabolic changes, certain diabetes medications that promote weight gain, and generally higher insulin resistance, all of which can blunt weight-loss response to a given treatment.
Gastrointestinal side effects were also more common in STEP 2 than in STEP 1, occurring in 63.5% of the semaglutide group versus 34.3% on placebo. Several of the diabetes medications people in this trial were already taking, including metformin, can themselves cause digestive side effects, which may have made it harder for some participants to tolerate dose increases as smoothly as the non-diabetic population in STEP 1 did.
What This Means If You Have Diabetes and Are Considering Wegovy
If you have type 2 diabetes, STEP 2’s 9.6% average, not STEP 1’s 14.9%, is the more directly relevant trial-based reference point, and it’s reasonable to expect a somewhat smaller result than headlines built around STEP 1 suggest. That doesn’t mean Wegovy “doesn’t work” for people with diabetes; 68.8% of the STEP 2 semaglutide group still lost at least 5% of their body weight, a threshold linked to measurable health benefits. It does mean the realistic range of outcomes shifts downward compared with a non-diabetic population, which is worth naming explicitly in a conversation with a prescriber rather than discovering by comparison later.
STEP 2 also tracked blood sugar control alongside weight, and the semaglutide group saw meaningfully larger improvements in measures like HbA1c than the placebo group did, on top of the weight result. For someone managing type 2 diabetes, that combined effect, smaller average weight loss than a non-diabetic population might see, paired with a glycemic benefit the non-diabetic trials couldn’t measure in the first place, is arguably a more complete picture than the weight percentage alone.
Weight Loss in People Without Diabetes: STEP 1 and STEP 3
STEP 1 already covers the no-diabetes population at its simplest; STEP 3 asks what happens when semaglutide is paired with more intensive lifestyle support.
Adding Structured Behavioral Support: The STEP 3 Trial
STEP 3 enrolled 611 adults without diabetes and added intensive behavioral therapy and an initial low-calorie diet on top of semaglutide, producing the highest average result in the core program: 16.0% body-weight loss, versus 5.7% on a placebo-plus-behavioral-therapy group. Both numbers in that comparison are higher than STEP 1’s placebo arm, which makes sense: structured counseling and a supervised eating plan have their own, separate effect on weight, on top of whatever the medication contributes. STEP 3 doesn’t prove semaglutide works better with therapy in some pharmacological sense; it shows that combining the drug with more intensive support produced the largest average result anywhere in the program.
The behavioral therapy in STEP 3 wasn’t a casual add-on: participants met frequently with counselors trained in weight management, followed a defined low-calorie eating plan during the first two months, and received ongoing structured support for the full 68 weeks. That level of support goes well beyond what a typical prescription for Wegovy includes on its own, which is a point this guide returns to when explaining the gap between trial and real-world results later on.
What Explains the Gap Between These Populations
Lined up together, the no-diabetes trials (STEP 1 and STEP 3) cluster in the 15% to 16% range, while the diabetes-specific trial (STEP 2) sits closer to 10%. That gap is one of the most consistent, well-replicated patterns in the entire STEP program, and it’s a more useful planning number than a single blended average that papers over the difference. If a reader searching for “how much weight can you lose on Wegovy” has type 2 diabetes, the honest, evidence-based answer is a materially different number than the one usually quoted in general coverage. Our guide to metformin compared with Wegovy goes deeper into how diabetes-focused medications stack up against semaglutide specifically for readers weighing that choice.
This same pattern is a large part of why a single quoted percentage for “Wegovy results” so often frustrates people once they start comparing notes with others taking the same medication. Two people can both be taking semaglutide 2.4 mg in good faith, follow their prescriber’s plan closely, and still land in meaningfully different ranges simply because one of them has type 2 diabetes and the other doesn’t, before any other individual factor is even considered.
| Trial | Group | ≥5% | ≥10% | ≥15% | ≥20% |
|---|---|---|---|---|---|
| STEP 1 | Semaglutide 2.4 mg | 86.4% | 69.1% | 50.5% | Not reported in sources read for this guide |
| STEP 1 | Placebo | 31.5% | 12.0% | 4.9% | Not reported in sources read for this guide |
| STEP 2 | Semaglutide 2.4 mg | 68.8% | Not reported in sources read for this guide | Not reported in sources read for this guide | Not reported in sources read for this guide |
| STEP 2 | Placebo | 28.5% | Not reported in sources read for this guide | Not reported in sources read for this guide | Not reported in sources read for this guide |
| STEP 5 (2-year) | Semaglutide 2.4 mg | 77.1% | Not reported in sources read for this guide | Not reported in sources read for this guide | Not reported in sources read for this guide |
| STEP 5 (2-year) | Placebo | 34.4% | Not reported in sources read for this guide | Not reported in sources read for this guide | Not reported in sources read for this guide |
| STEP 8 | Semaglutide 2.4 mg | Not reported in sources read for this guide | 70.9% | 55.6% | 38.5% |
| STEP 8 | Liraglutide 3.0 mg | Not reported in sources read for this guide | 25.6% | 12.0% | 6.0% |
Table 3 method: figures are as reported in each cited trial or trial summary, read as of October 2, 2026. Blank-labeled cells reflect figures that weren’t reported in the specific sources read for this guide, not a zero result; each row is a separate trial, so comparing across trials (for example, STEP 1 to STEP 8) is a side-by-side look, not a head-to-head comparison except where a single trial tested two arms directly, as STEP 8 did.
How Wegovy’s Results Compare With Liraglutide and a Newer High-Dose Option
Two more pieces of evidence round out the picture: a trial that compared semaglutide directly against an older weight-loss injection, and a 2026 trial behind a stronger dose of semaglutide itself.
Head-to-Head Evidence: Wegovy vs. Daily Liraglutide (STEP 8)
STEP 8 is the one STEP trial built specifically as a head-to-head comparison rather than a placebo-controlled study of semaglutide alone.
Weight-Loss Thresholds Reached in STEP 8
STEP 8 randomized 338 adults without diabetes to weekly semaglutide 2.4 mg, daily liraglutide 3.0 mg (the active ingredient in Saxenda), or placebo for 68 weeks, and found semaglutide produced a 15.8% average weight loss versus 6.4% for liraglutide. The gap held up at every threshold: 70.9% of the semaglutide group reached at least 10% weight loss versus 25.6% on liraglutide; 55.6% reached at least 15% versus 12.0%; and 38.5% reached at least 20% versus just 6.0%. This is a genuine within-trial, head-to-head result, not a cross-trial comparison, which makes it one of the stronger individual data points in this entire guide.
Roughly 126 participants were assigned to semaglutide and 127 to liraglutide, with the remainder assigned to placebo, and all three groups followed the same 68-week window and the same background diet and activity counseling. Because the two active drugs were tested in the very same trial, at the same time, in the same population, this comparison avoids the “different populations, different durations” caveat that applies to most of the other cross-trial comparisons in this guide.
Why Tolerability Likely Explains Part of the Gap
Discontinuation due to side effects was considerably lower with semaglutide than liraglutide in STEP 8: 3.2% versus 12.6%. Liraglutide requires a daily injection and its own dose-titration process, and a meaningfully larger share of that group stopped treatment before completing the trial. Some of semaglutide’s larger average result in this specific comparison likely reflects that more people stayed on it long enough to reach its full effect, on top of whatever difference exists between the two drugs’ effects on appetite at a given point in treatment.
This tolerability gap is a useful, concrete example of a theme that runs through this entire guide: a drug’s trial-reported average result is partly a reflection of how many people could actually stay on it long enough to see that result, not solely a measure of its biological potency. A medication with a slightly smaller theoretical ceiling but much better tolerability can, in practice, outperform one with a higher ceiling that too many people stop taking early.
Wegovy HD (7.2 mg): A Higher-Dose Option Approved in 2026
In March 2026, FDA approved a higher-strength version of semaglutide, marketed as Wegovy HD, based on a newer trial most readers won’t yet have encountered.
What the STEP UP Trial Found
The STEP UP trial randomized 1,407 adults with obesity and no diabetes to semaglutide 7.2 mg, semaglutide 2.4 mg, or placebo for 72 weeks, and found the 7.2 mg dose produced an average 20.7% body-weight loss, with 89% of that group reaching at least 5% weight loss. That’s a meaningfully larger average than any dose tested earlier in the STEP program, though it comes from a single newer trial rather than the years of accumulated evidence behind the 2.4 mg dose, and the specific placebo-arm percentage wasn’t reported in the sources read for this guide.
Participants were split 5:1:1 across the 7.2 mg, 2.4 mg and placebo arms, meaning the bulk of the trial population was assigned to the higher dose being tested, with smaller comparison groups on the standard dose and placebo. That design is typical for a trial meant mainly to confirm a new dose’s benefit over an existing, already-approved one, rather than to generate a large, precise placebo-controlled estimate the way STEP 1 did for the original 2.4 mg dose.
Who the Higher Dose Is, and Isn’t, For
Wegovy HD isn’t positioned as a starting dose. FDA approved it specifically for adults who have already tolerated the standard 2.4 mg dose for at least 4 weeks and for whom a prescriber judges additional weight reduction clinically appropriate. In other words, it’s a step-up option layered on top of existing treatment, not a faster on-ramp for someone just beginning semaglutide. Anyone curious whether the higher dose is appropriate for their own situation should raise it directly with the prescriber managing their current treatment rather than requesting it as a first prescription.
Because the higher dose delivers more active medication each week, it’s reasonable to expect at least a similar pattern of gastrointestinal side effects as the standard dose, and possibly more pronounced effects for some people, though this guide didn’t find a precise, directly reported side-effect rate specifically for the 7.2 mg arm in the sources read this session. Anyone moving up to the higher dose should expect the same kind of careful, gradual approach that applied to the original titration schedule, not an assumption that tolerability at 2.4 mg automatically predicts a smooth transition to 7.2 mg.
What Happens If You Stop Taking Wegovy?
Every result covered so far describes people actively taking the medication. What happens after stopping is a separate, and separately important, body of evidence.
The STEP 1 Extension: Weight Regain in the Year After Stopping
A subset of STEP 1 participants were followed for an additional year after their assigned treatment ended, specifically to answer this question.
How Much Weight Came Back Off-Treatment
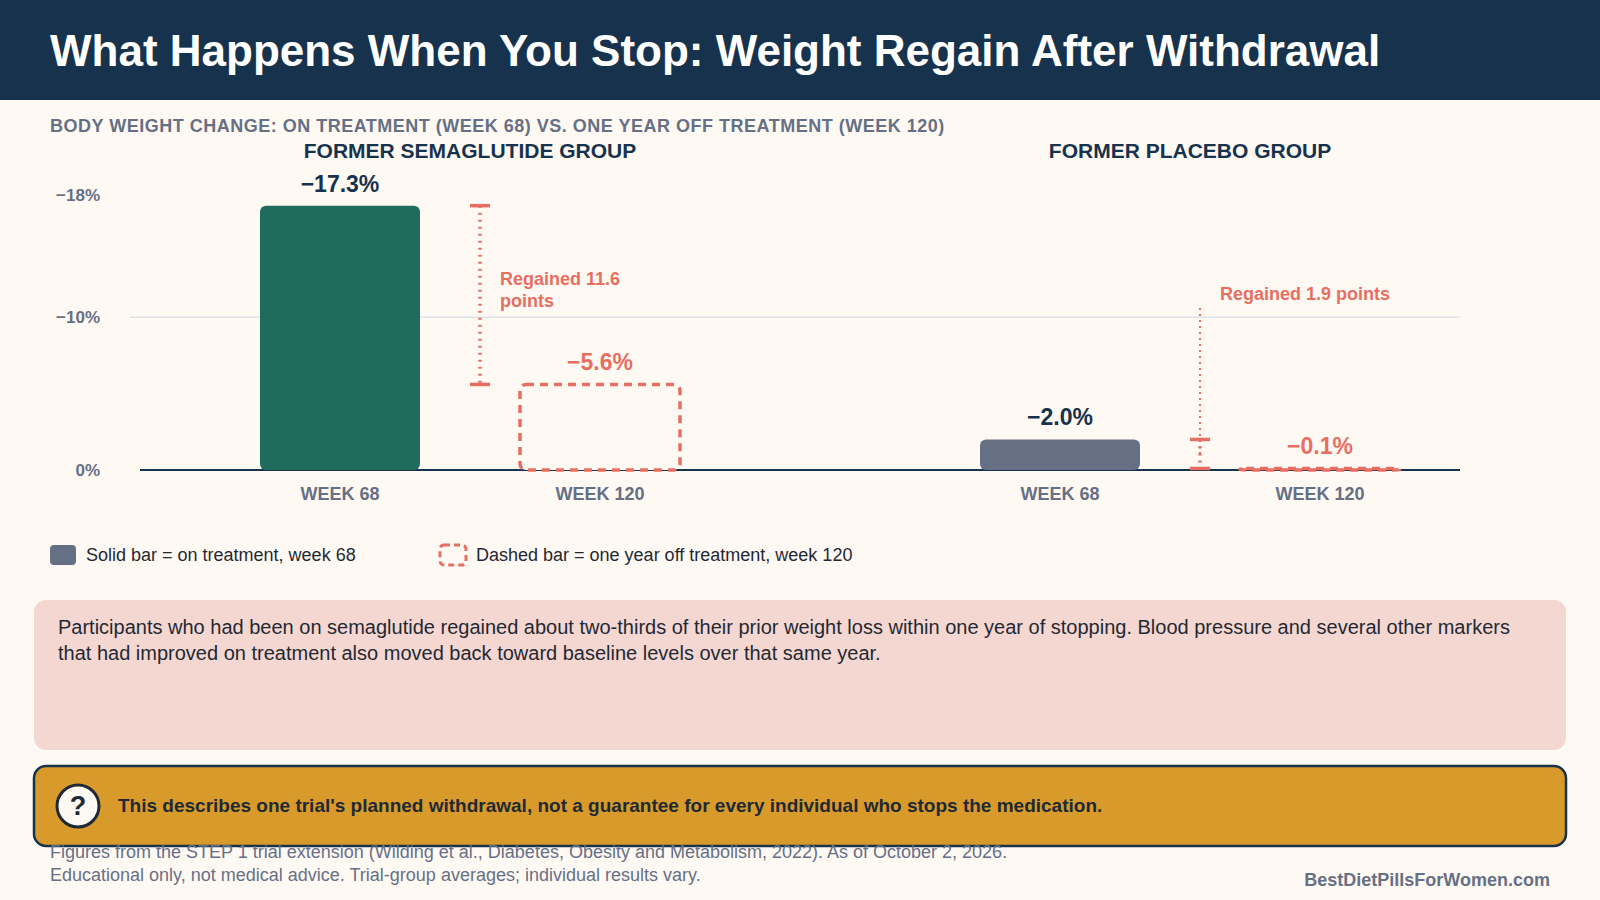
In the STEP 1 extension, participants who’d lost an average 17.3% of body weight by week 68 on semaglutide regained 11.6 percentage points over the following year off treatment, while the placebo group, who had lost only 2.0% by week 68, regained 1.9 points. Net across the full 120 weeks, that left the former semaglutide group at an average 5.6% below their original starting weight, and the former placebo group essentially back at 0.1% below baseline. Researchers who ran the analysis describe this as participants regaining about two-thirds of the weight they’d lost within one year of stopping.
This specific subgroup’s 17.3% on-treatment result at week 68 is a bit higher than STEP 1’s full-trial average of 14.9%, which reflects the fact that this extension followed a particular subset of original participants rather than the entire trial population. That detail doesn’t change the core finding about regain, but it’s worth noting that the extension’s two headline percentages, 17.3% and 5.6%, shouldn’t be read as literally the same cohort as the 14.9% figure quoted earlier in this guide.
What Else Reversed Besides the Number on the Scale
The regain wasn’t limited to body weight. Blood pressure, which had improved on treatment, rose back toward baseline levels in both the former-semaglutide and former-placebo groups by week 120. C-reactive protein and several lipid markers also moved in an unfavorable direction after semaglutide was stopped, though some lipid improvements, including triglycerides, remained partially better than the placebo group even a year off treatment. HbA1c, a marker of blood sugar control, increased in both groups after withdrawal, with a larger increase in the former-semaglutide group, though it still ended slightly better than placebo.
Appetite itself appears to be part of what rebounds. The same broad pattern, hunger and fullness signals shifting back toward a pre-treatment baseline once the medication clears the body, is consistent with semaglutide’s known mechanism: it works by mimicking a natural gut hormone, and once that extra signal is withdrawn, the body’s own appetite regulation reasserts itself. That’s a physiological explanation for the regain pattern, not a statement that stopping treatment reflects any failure on a person’s part.
What the Regain Pattern Means for Long-Term Planning
The STEP 1 extension data lines up with how obesity medicine specialists have come to talk about GLP-1 medications generally, and it has practical implications for anyone starting treatment.
Why Obesity Medicine Treats This as an Ongoing Condition
The regain pattern in the STEP 1 extension is a major reason clinicians increasingly describe obesity as a chronic condition requiring ongoing management, similar to high blood pressure, rather than a problem semaglutide “cures” after a defined course of treatment. That framing isn’t a sales pitch for staying on medication indefinitely; it’s a description of what the best available evidence currently shows happens to the body’s appetite and weight-regulation signals once the drug is withdrawn. Anyone who starts Wegovy expecting the result to be permanent after a single course of treatment is working from an assumption the trial data doesn’t support.
This same logic underlies Wegovy’s separate FDA-approved use for reducing cardiovascular risk in adults with established heart disease and obesity or overweight, which rests on the idea of sustained, ongoing treatment rather than a short course. That cardiovascular indication is a distinct topic from the weight-loss results this guide focuses on, but it reinforces the same underlying point: semaglutide’s studied benefits, across every indication FDA has reviewed, are tied to continued use, not a one-time intervention.
Questions Worth Raising Before Stopping
Before stopping Wegovy for any reason, cost, side effects, pregnancy planning or simply feeling “done,” it’s worth asking a prescriber what specifically to expect, whether a gradual dose reduction or a different ongoing strategy makes sense for your situation, and how your other health markers (blood pressure, blood sugar, cholesterol) might shift afterward based on what you were tracking while on treatment. Nothing in this guide should be read as advice to continue or discontinue any specific medication; that decision belongs with a clinician who knows your full history. Readers interested in the broader side-effect picture across GLP-1 medications may also want our overview of GLP-1 medication side effects.
It’s also worth asking what non-medication habits built during treatment, higher protein intake, more consistent movement, smaller portion sizes, might be worth keeping deliberately in place after stopping, since those habits don’t automatically disappear along with the drug’s direct appetite effect, even if they can’t fully replace it on their own.
Why Your Real-World Results May Look Different From the Trial Averages
Clinical trials run under close supervision, with scheduled visits, dose support and, often, no out-of-pocket cost for participants. Everyday prescribing doesn’t look the same, and a 2025 study put real numbers to that gap.
What a Recent Real-World Study Actually Found
A Cleveland Clinic research team examined outcomes for thousands of real-world patients who started GLP-1 medications, including semaglutide, outside the structure of a clinical trial.
Average Results by How Long People Stayed on Treatment
Among 7,881 adults with obesity who started GLP-1 therapy between 2021 and 2023, those who stayed on treatment through one year lost an average of 11.9% of their body weight, lower than STEP 1’s 68-week trial average of 14.9%, while patients specifically on a high-dose semaglutide regimen averaged 13.7%. That’s still a substantial, clinically meaningful result, but it sits noticeably below the headline trial figure, and it only describes the subset of patients who actually remained on treatment for the full year.
The same cohort also included patients on tirzepatide, a related but different GLP-1 and GIP medicine sold under other brand names; high-dose tirzepatide maintainers in this real-world study averaged an 18.0% loss, higher than the comparable semaglutide figure. That difference is a separate topic from this guide’s focus and is covered in more depth in our companion guide to tirzepatide’s own clinical trial results; it’s mentioned here only to show that the trial-versus-real-world gap this section describes shows up across this entire drug class, not only with semaglutide.
Why Nearly Half of Patients Didn’t Stay on Treatment at All
The same study found that patients who discontinued treatment early, within the first three months, averaged only 3.6% weight loss, and those who discontinued later, between three and 12 months, averaged 6.8%. The researchers reported that nearly half of patients in the cohort discontinued therapy altogether, most commonly citing cost or insurance-related barriers, with gastrointestinal side effects and medication shortages also playing a role.
Medication shortages are worth underlining specifically, since they affected real patients’ continuity of treatment in ways no clinical trial protocol would allow. A person who wants to stay on a consistent dose but can’t reliably fill a prescription month to month is facing a structural barrier that has nothing to do with how their body responds to the drug itself, yet it still shows up in their eventual weight-loss number. A trial’s 68-week average describes people who, by design, kept taking the medication for 68 weeks; real-world prescribing includes everyone who started, including the large share who didn’t make it that far.
The Main Reasons Individual Results Vary
Several concrete, identifiable factors sit behind the gap between trial and real-world numbers, and most of them are things a patient and prescriber can actually discuss and plan around.
Dose Reached, Titration Pace, and Time on Treatment
Clinical trial participants follow a protocol-mandated titration schedule and are followed closely enough that most reach the full 2.4 mg maintenance dose. In everyday practice, the Cleveland Clinic researchers specifically pointed to lower maintenance dosing patterns, meaning some patients plateau at a lower dose than the one STEP 1’s headline number was measured at, often because of side effects, cost of a higher-dose pen, or a prescriber’s own titration pace. Someone who never reaches 2.4 mg, or reaches it only briefly, has little reason to expect STEP 1’s full 14.9% average.
A pen shortage or an insurance formulary change can also force someone to pause partway through titration and restart later, which resets some of the body’s adjustment to the medication and can slow the overall timeline described earlier in this guide. None of that reflects the drug “not working”; it reflects the difference between a controlled research protocol and the more variable reality of pharmacy supply, insurance approvals and day-to-day life.
Diet, Support, and Follow-Up Built Into a Clinical Trial
STEP trial participants also received structured counseling on diet and activity as part of the study protocol, plus regular scheduled contact with the research team, neither of which is a given in routine primary-care or telehealth prescribing. STEP 3’s considerably larger result when intensive behavioral therapy was added on top of the same drug and dose is itself evidence that the surrounding support matters, not just the prescription.
A busy primary-care visit or an asynchronous telehealth check-in simply isn’t built to provide the same cadence of dietitian contact, behavioral coaching and side-effect troubleshooting that a funded clinical trial can offer its participants. That gap in support, more than any difference in the medication itself, is a reasonable candidate for a meaningful share of the difference between STEP 3’s 16.0% and the Cleveland Clinic cohort’s 11.9%. None of this means Wegovy “doesn’t work” outside a trial; it means the full trial-level result assumes a level of dose, consistency and support that not every real-world patient receives, and that gap, not a change in the drug itself, explains most of the difference.
| Group | Average weight loss (around 1 year) | Source |
|---|---|---|
| STEP 1 trial participants (semaglutide, 68-week trial) | 14.9% | STEP 1 |
| Real-world patients who stayed on treatment through 1 year | 11.9% | Cleveland Clinic retrospective cohort |
| Real-world patients on a high-dose semaglutide regimen specifically | 13.7% | Cleveland Clinic retrospective cohort |
| Real-world patients who discontinued early (under 3 months) | 3.6% | Cleveland Clinic retrospective cohort |
| Real-world patients who discontinued later (3–12 months) | 6.8% | Cleveland Clinic retrospective cohort |
Table 4 method: the STEP 1 figure is the trial’s reported 68-week average; the real-world figures are as reported in the 2025 retrospective cohort study of 7,881 adults who started GLP-1 therapy between 2021 and 2023, read as of October 2, 2026. The two settings differ in dose consistency, follow-up, and cost barriers, so this is a side-by-side look at different circumstances, not a controlled comparison.
Safety Considerations That Can Affect Whether You Reach These Results
Side effects aren’t just a separate safety topic from “how much weight will I lose.” They’re one of the main practical reasons an individual result ends up smaller than a trial average, which is why this section belongs in a results-focused guide.
Common Side Effects That Can Limit Dose or Adherence
Most people who take Wegovy experience some digestive side effects, particularly while the dose is being increased.
Gastrointestinal Side Effects and Why They Matter for Results
Nausea, diarrhea, vomiting, constipation and abdominal pain are the most commonly reported side effects across the STEP trials, and they tend to cluster around each dose increase rather than staying constant throughout treatment. These effects are usually mild to moderate and often ease as the body adjusts to a given dose, but they’re also a major reason some people and prescribers choose to slow down titration, hold at a lower dose longer than the standard schedule, or avoid pushing all the way to 2.4 mg. Each of those choices, individually reasonable, can also mean settling for a smaller average result than the headline trial figures.
Headache and fatigue are also reported, though less consistently than the digestive effects, and some people notice them most around the same dose-increase windows. Simple, commonly suggested habits like eating smaller meals, slowing down while eating, and limiting greasy or very rich food can make the digestive side effects more manageable for some people, though none of that substitutes for telling a prescriber about symptoms that are severe or that aren’t easing over time.
When Side Effects Lead Someone to Stop Treatment Early
A meaningful share of people in both clinical trials and real-world settings stop semaglutide specifically because of side effects, and the real-world data above shows how much that costs in terms of eventual weight loss. If digestive side effects are severe, persistent, or not improving over several weeks at a given dose, that’s worth bringing back to a prescriber promptly rather than quietly discontinuing; there are often options, including a slower titration pace or temporary dose reduction, that let someone stay in treatment rather than stopping altogether.
Quietly stopping without telling a prescriber also means losing the chance to troubleshoot, since a dose that feels intolerable this month might be manageable with a different timing, a temporary pause at a lower step, or added support for nausea. Framing a bad week of side effects as a reason to call the office, rather than a reason to quit outright, keeps more realistic options on the table.
Serious Risks and Who Needs Extra Caution
Beyond the common digestive effects, Wegovy carries a boxed warning and a smaller set of less common but more serious risks worth understanding before starting.
The Boxed Warning and Who Shouldn’t Use Wegovy
Wegovy’s FDA label carries a boxed warning about thyroid C-cell tumors, based on findings in rodent studies; it isn’t known whether this risk applies to humans, but out of caution, the drug is contraindicated for anyone with a personal or family history of medullary thyroid carcinoma or multiple endocrine neoplasia syndrome type 2. Anyone with that personal or family history shouldn’t take Wegovy at all, and it’s a question worth answering clearly before a first prescription is written, not something to mention casually after starting.
Medullary thyroid carcinoma itself is rare in the general population, and most people starting Wegovy have no personal or family history of it. That rarity is exactly why the label relies on a screening question rather than a required test for everyone; a prescriber who asks about thyroid cancer and endocrine tumor history before prescribing is following standard practice, not being unusually cautious.
Pregnancy, Gallbladder Disease, and Other Precautions
Wegovy isn’t recommended during pregnancy, and current labeling calls for stopping the medication before a planned pregnancy, given the rapid weight loss and limited human safety data in pregnancy. People with a history of pancreatitis, gallbladder disease or diabetic retinopathy also warrant extra caution and closer monitoring, since rapid weight loss itself can affect gallbladder function and, in people with type 2 diabetes and existing retinopathy, has been associated with a short-term worsening of eye complications in some trial data. None of this is a complete list, and a full medical history review with a prescriber, not a general article, is the right way to screen for any of it.
Semaglutide also stays in the body for some time after the last dose, which is part of why labeling calls for stopping well ahead of a planned pregnancy rather than simply at a positive test. Breastfeeding is another area where current safety data is limited, and anyone who is pregnant, breastfeeding or actively planning either should raise it directly with a prescriber before starting or continuing Wegovy, rather than assuming the general trial population’s safety profile automatically applies.
Frequently Asked Questions About Wegovy Weight-Loss Results
A few questions come up often enough to answer directly, even where the answer repeats a point made earlier in more depth.
Questions About How Much and How Fast
How much weight will I actually lose on Wegovy?
Trial averages range from about 9.6% of body weight (STEP 2, in people with type 2 diabetes) to 16.0% (STEP 3, with added behavioral therapy), with STEP 1’s commonly cited 14.9% sitting in between for adults without diabetes. Your own result depends heavily on your health status, the dose you reach and tolerate, and how long you stay on treatment, so treat any single number as a reference range rather than a personal forecast.
Real-world data suggests a reasonable planning range for someone who stays consistently on treatment is somewhat below the trial averages, closer to the low-to-mid teens as a percentage of starting weight, with people who can’t stay on treatment for a full year landing considerably lower.
How soon will I notice results after starting Wegovy?
Appetite changes and modest weight loss often begin within the first few weeks, even at the lowest starting dose, but the bulk of the eventual result builds gradually over several months as the dose increases toward the 2.4 mg maintenance level around week 17. Trial data suggests the steepest part of the weight-loss curve runs through roughly the first five months of treatment, with continued, slower loss for several months after that before results tend to level off.
If you’ve been on the medication for a month or two and the scale has barely moved, that’s not necessarily unusual, especially while still early in the dose-titration schedule; it’s worth mentioning at a follow-up visit rather than assuming something has gone wrong.
Questions About Sustaining and Comparing Results
Will I gain the weight back if I stop taking Wegovy?
Evidence from the STEP 1 extension suggests most people do regain a substantial share of the weight, roughly two-thirds of what they’d lost, within one year of stopping treatment. That’s a major reason many obesity medicine specialists describe ongoing treatment, not a fixed course followed by discontinuation, as the realistic path to maintaining results, though any decision about starting, continuing or stopping belongs in a conversation with your own prescriber.
It’s worth repeating that this comes from one specific trial’s planned withdrawal, not a universal law; some individuals may regain less, or more, depending on factors this guide can’t predict for any one reader.
Does Wegovy stop working as well after a year or two?
Not according to the longest trial data available: STEP 5 found essentially the same average result at two years (15.2%) as STEP 1 found at 68 weeks (14.9%), suggesting the medication’s effect holds rather than fading with continued use. What does change over time, for many people, is that the sharpest weight loss happens earlier in treatment, with the later months mostly maintaining a new, lower weight rather than continuing to push it down further.
No STEP trial read for this guide followed participants on continuous treatment much beyond two years, so this guide can’t speak with the same confidence to what a third, fourth or fifth year of continuous use looks like; that’s one of the more honest gaps in the current evidence.
The Bottom Line on Wegovy’s Weight-Loss Results
Pulling every trial and every caveat together, a few conclusions are worth stating plainly.
What the Total Evidence Means for You
The STEP program is a large, consistent, FDA-reviewed body of evidence, and it points toward one dependable pattern even as the exact number moves around.
The Realistic Range, Not a Single Number
Across the trials in this guide, average weight loss on semaglutide 2.4 mg ranges from roughly 9.6% to 16.0% depending on population and support, with a newer 7.2 mg dose reaching an average of 20.7% in its own single trial; real-world patients who stay on treatment a full year average closer to 11.9%. The single most useful number from this entire guide isn’t any one of those percentages; it’s the range itself, and the understanding that where you land within it depends on factors you can actually influence and discuss with a prescriber.
Treat marketing materials or social-media posts that quote a single, high percentage as a floor-to-ceiling range compressed into one number, not as a typical individual result. The STEP program’s own data, read in full rather than as a single headline figure, is the more honest starting point.
How Confident the Evidence Actually Is
Confidence in the general size and direction of these results is high: the core findings come from multiple large, randomized, placebo-controlled trials that FDA itself reviewed for approval, and the diabetes-versus-no-diabetes gap in particular has shown up consistently across trials. Confidence is lower, and more provisional, around the newer 7.2 mg dose, which rests on one trial rather than years of accumulated data, and around exactly how individual factors like dose tolerance and adherence combine to predict any one person’s specific result, which no single trial was designed to answer.
Several of the specific figures in this guide were also read through secondary trial summaries rather than complete original journal articles, since full-text access wasn’t available for every source in this research session; that’s noted in detail in this guide’s internal source log, and it’s a reason to treat exact decimal-point figures as reliable in direction and rough size, while still re-verifying them against a primary source before using them in any high-stakes decision.
A Rational Next Step
None of this evidence is a reason to assume Wegovy is automatically right, or automatically wrong, for any particular reader.
Questions Worth Bringing to a Clinician
If you’re considering Wegovy, ask directly what result is realistic given your own health history, including whether type 2 diabetes or other conditions might shift your expected range, what the plan is if side effects make full titration difficult, and how long-term use, rather than a defined course, fits into the conversation given what the STEP 1 extension found about regain. If cost or access is the main barrier, our guide to Wegovy’s current cost and coverage and our broader comparison of prescription and over-the-counter weight-loss pills cover more of that ground. Readers specifically weighing semaglutide against tirzepatide or against Ozempic may also find those comparisons useful next steps.
It’s also reasonable to ask a prescriber how they’ll measure progress beyond the number on the scale, including blood pressure, blood sugar and how clothes fit, since the STEP trials themselves tracked more than body weight alone, and a narrow focus on one number can obscure real, meaningful progress happening elsewhere.
What to Re-Check Before You Decide Anything
Trial data, FDA label language, dosing options and insurance coverage can all change within weeks of when this guide was checked. Before making any decision, reverify Wegovy’s current FDA label directly, confirm whether the 7.2 mg option has since become more widely available or studied further, and talk with a prescriber about where your own health profile fits within the ranges this guide describes. The honest, evidence-based answer to “how much weight will I lose on Wegovy” is a range shaped by real, identifiable factors, not a single marketing-friendly percentage, and that range is a better starting point for a real conversation with a clinician than any one number could be on its own. Readers managing weight alongside midlife hormonal changes may also want our guides on weight loss after 40, PCOS-related weight concerns and menopause-related weight gain, each of which connects back to how GLP-1 medications like Wegovy fit into a broader plan. Anyone curious how a related GLP-1 medicine’s own trial results compare may also want our companion guide to tirzepatide’s clinical trial results, and anyone dealing with a stalled result after months of steady progress may find our guide to breaking through a weight-loss plateau useful alongside this one.
Related Reading
Sources
These are the main sources behind this guide, chosen because they are the ones to check first for current facts. Trial summaries, labels and newer data change, so confirm the latest version before you make decisions.
- U.S. Food and Drug Administration. WEGOVY (semaglutide) injection, for subcutaneous use — prescribing information, label archive version 215256s011 (2024 posting; newer archived versions exist, including updates that should reflect the March 2026 approval of Wegovy HD (semaglutide 7.2 mg); check the current approved label text before publication). https://www.accessdata.fda.gov/drugsatfda_docs/label/2024/215256s011lbl.pdf
- Wilding JPH, et al. Once-Weekly Semaglutide in Adults with Overweight or Obesity (the STEP 1 trial), New England Journal of Medicine, 2021 (PubMed record; read this session via a secondary clinical summary of the published trial, not the full NEJM text). https://pubmed.ncbi.nlm.nih.gov/33567185/
- Davies M, et al. Semaglutide 2.4 mg once a week in adults with overweight or obesity and type 2 diabetes (STEP 2), The Lancet, 2021 (read this session via NHS Medicines Resources’ summary of the published trial, not the full Lancet text). https://www.medicinesresources.nhs.uk/semaglutide-2-4-mg-once-a-week-in-adults-with-overweight-or-obesity-and-type-2-diabetes-step-2-a-randomised-double-blind-double-dummy-placebo-controlled-phase-3-trial.html
- Wadden TA, et al. Effect of Subcutaneous Semaglutide vs Placebo as an Adjunct to Intensive Behavioral Therapy on Body Weight in Adults With Overweight or Obesity: The STEP 3 Randomized Clinical Trial, JAMA, 2021 (read this session via NHS Medicines Resources’ summary of the published trial, not the full JAMA text). https://www.medicinesresources.nhs.uk/effect-of-subcutaneous-semaglutide-vs-placebo-as-an-adjunct-to-intensive-behavioral-therapy-on-body-weight-in-adults-with-overweight-or-obesity-the-step-3-randomized-clinical-trial.html
- Rubino D, et al. Effect of Continued Weekly Subcutaneous Semaglutide vs Placebo on Weight Loss Maintenance in Adults With Overweight or Obesity: The STEP 4 Randomized Clinical Trial, JAMA, 2021 (read this session via HMP Global Learning Network’s summary of the published trial, not the full JAMA text). https://hmpgloballearningnetwork.com/site/frmc/news/continued-semaglutide-leads-further-weight-loss-patients-overweightobesity
- Garvey WT, et al. Two-year effects of semaglutide in adults with overweight or obesity: the STEP 5 trial, Nature Medicine, 2022 (PubMed record; read this session via a secondary summary of the published trial, not the full Nature Medicine text). https://pubmed.ncbi.nlm.nih.gov/36216945/
- Rubino DM, et al. Effect of Weekly Subcutaneous Semaglutide vs Daily Liraglutide on Body Weight in Adults With Overweight or Obesity Without Diabetes: The STEP 8 Randomized Clinical Trial, JAMA, 2022 (read this session via PatientCareOnline’s summary of the published trial, not the full JAMA text). https://www.patientcareonline.com/view/semaglutide-superior-to-liraglutide-for-weight-loss-in-head-to-head-study
- Wilding JPH, et al. Weight regain and cardiometabolic effects after withdrawal of semaglutide: The STEP 1 trial extension, Diabetes, Obesity and Metabolism, 2022 (open-access full text, read this session via UCL Discovery’s repository copy of the published article). https://discovery.ucl.ac.uk/id/eprint/10149199/1/Diabetes%20Obesity%20Metabolism%20-%202022%20-%20Wilding%20-%20Weight%20regain%20and%20cardiometabolic%20effects%20after%20withdrawal%20of%20semaglutide%20.pdf
- U.S. Food and Drug Administration approval of Wegovy HD (semaglutide 7.2 mg), based on the STEP UP trial, announced March 19, 2026 (read this session via ConsultantLive’s coverage of the approval and trial data, not FDA’s own approval letter directly). https://www.consultantlive.com/view/fda-approves-higher-dose-semaglutide-wegovy-hd-injection-7-2-mg-for-obesity
- Gasoyan H, et al. Cleveland Clinic retrospective cohort study of real-world weight-loss outcomes among adults who started GLP-1 medications between 2021 and 2023 (reported June 10, 2025; read this session via the Cleveland Clinic Newsroom’s summary of the published study, not the full journal article). https://newsroom.clevelandclinic.org/2025/06/10/cleveland-clinic-research-finds-injectable-medications-for-obesity-produce-smaller-weight-loss-in-a-real-world-setting-compared-to-randomized-clinical-trials

